Delve Tech Due Diligence · Meta-Analysis
Red Flag Analysis
Most common risks, what they mean, and which ones matter most
3.2
Avg Red Flags/Company
4.4
Avg Yellow Flags
8.8
Avg Green Flags
1535
Total Red Flags
Top Red Flag Categories
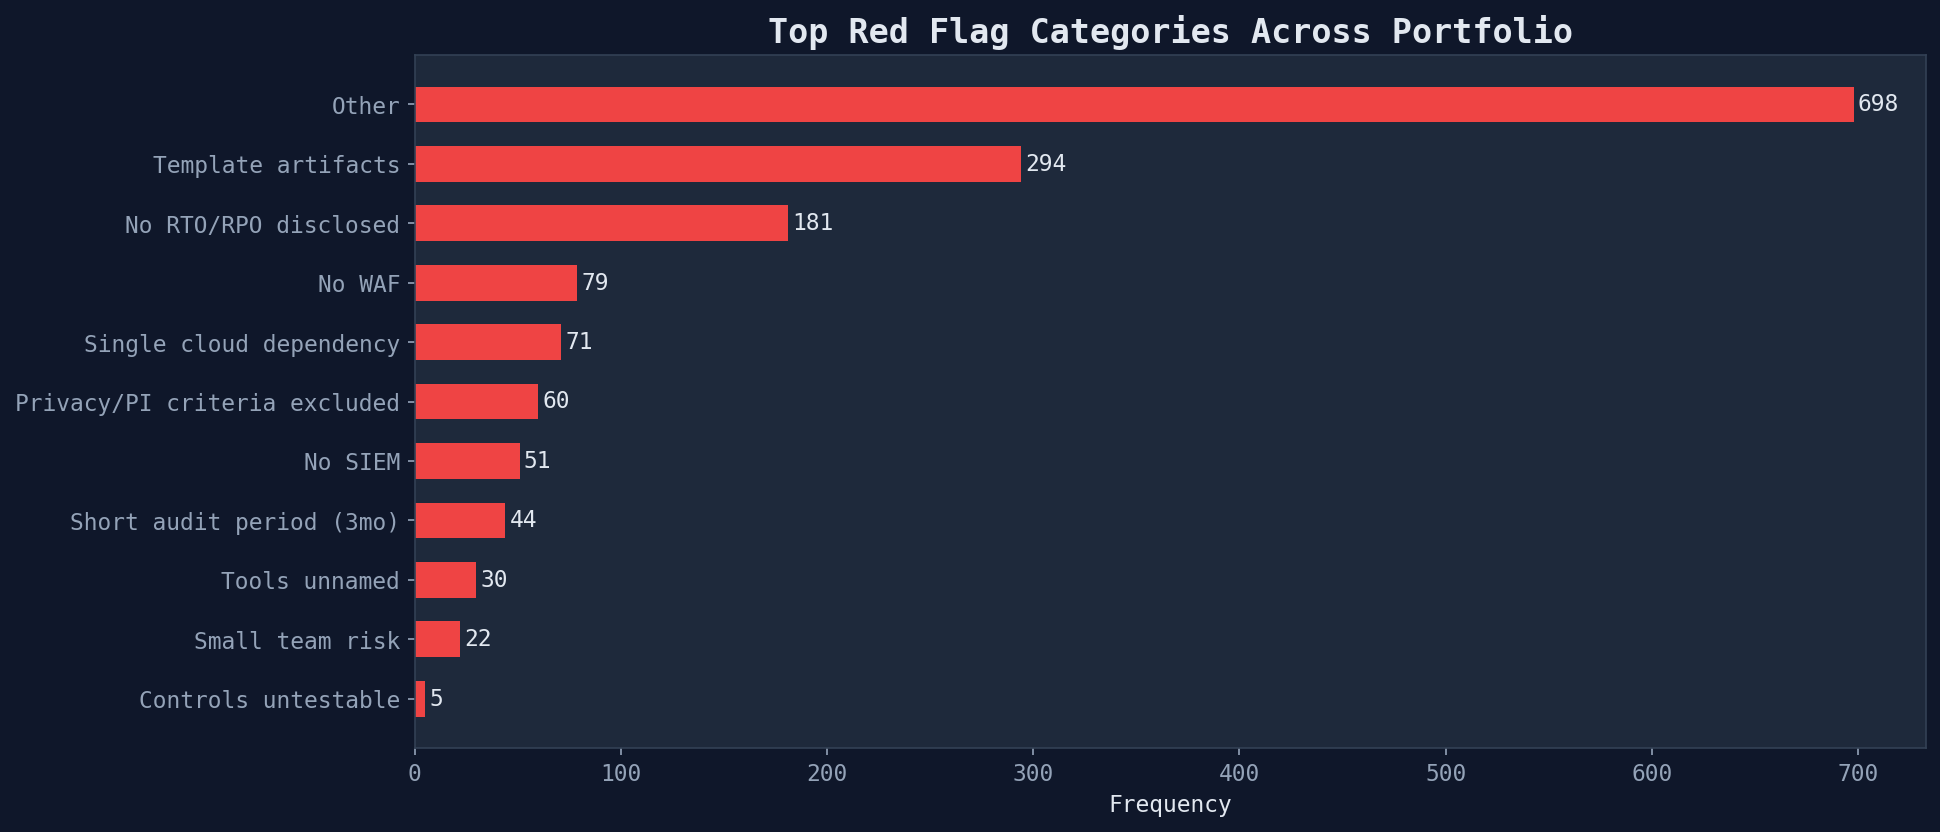
| Red Flag | Frequency | % of Portfolio |
|---|---|---|
| Other | 698 | 143.9% |
| Template artifacts | 294 | 60.6% |
| No RTO/RPO disclosed | 181 | 37.3% |
| No WAF | 79 | 16.3% |
| Single cloud dependency | 71 | 14.6% |
| Privacy/PI criteria excluded | 60 | 12.4% |
| No SIEM | 51 | 10.5% |
| Short audit period (3mo) | 44 | 9.1% |
The top 3 red flags are systemic: no RTO/RPO disclosure, short 3-month audit periods, and excluded privacy/processing integrity criteria. These aren't company-specific failures — they reflect the compliance automation template's defaults.
Flag Count Distribution
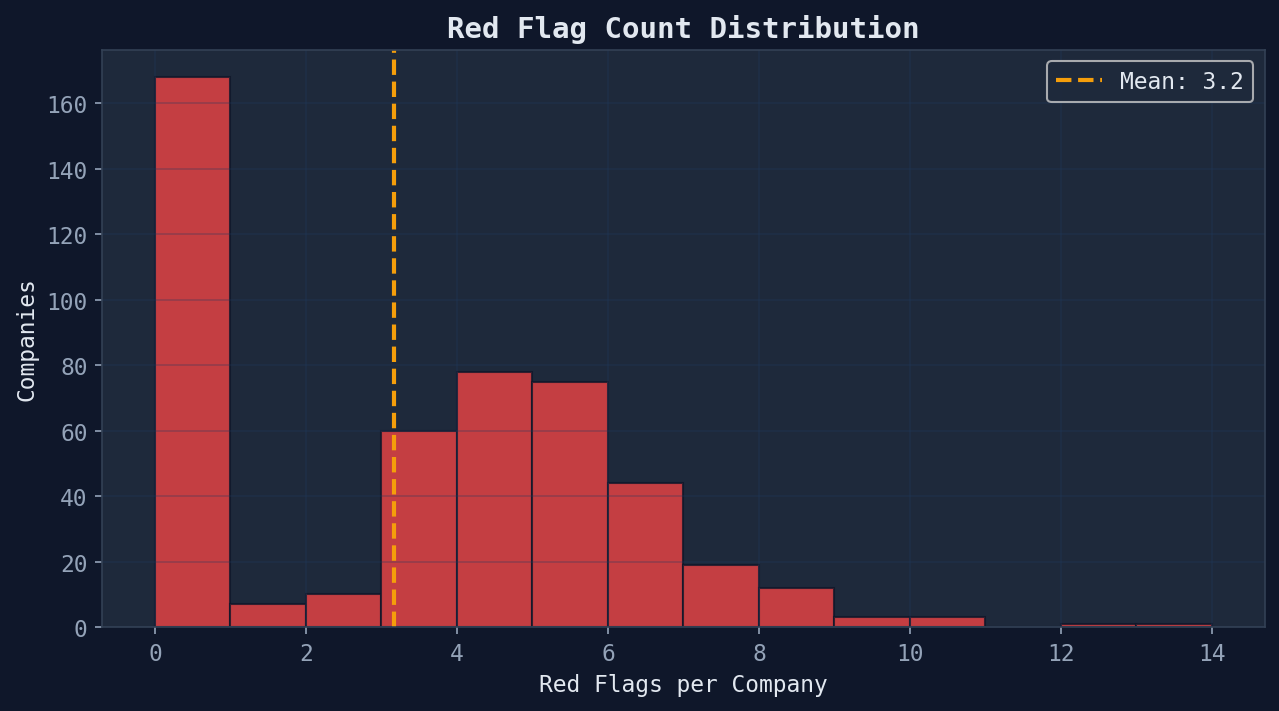
Average company has 3.2 red flags, 4.4 yellow flags, and 8.8 green flags.
Red Flags vs Score
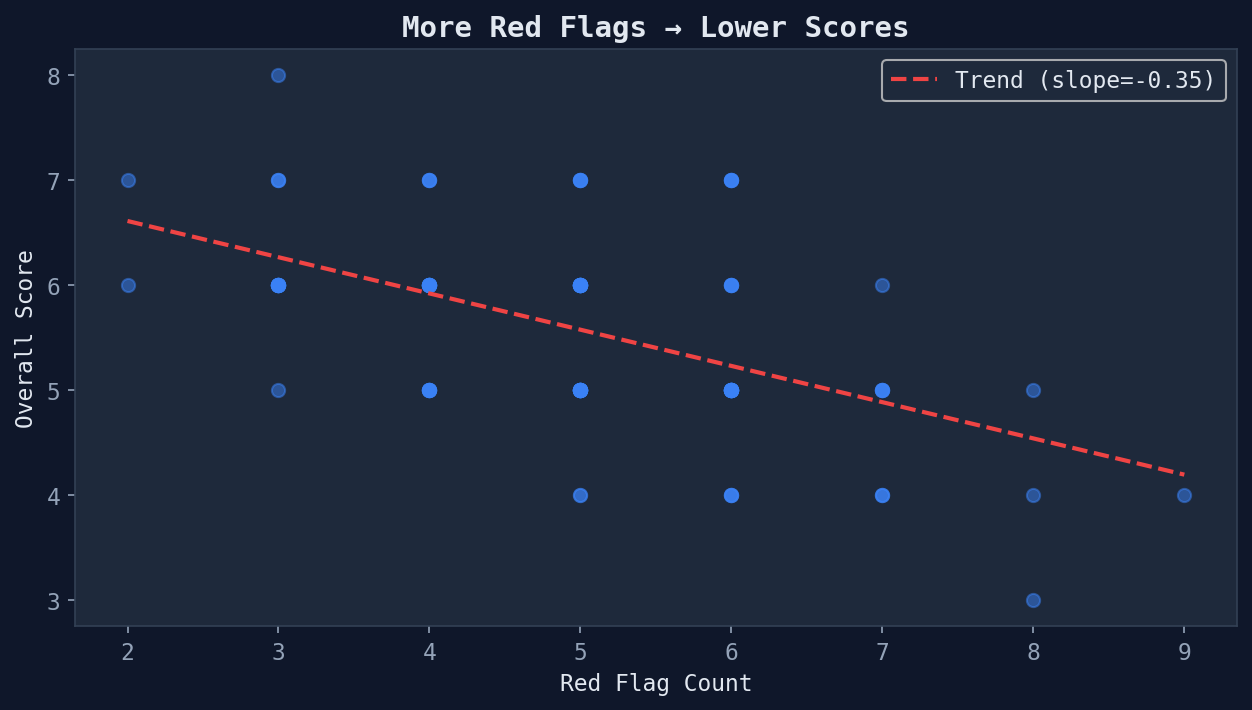
There is a negative correlation between red flag count and overall score. However, the relationship is noisy — some high-scoring companies still have many flags (often about audit period length rather than technical gaps).
Flag Balance by Score Tier
How does the red/yellow/green flag mix change across score tiers?
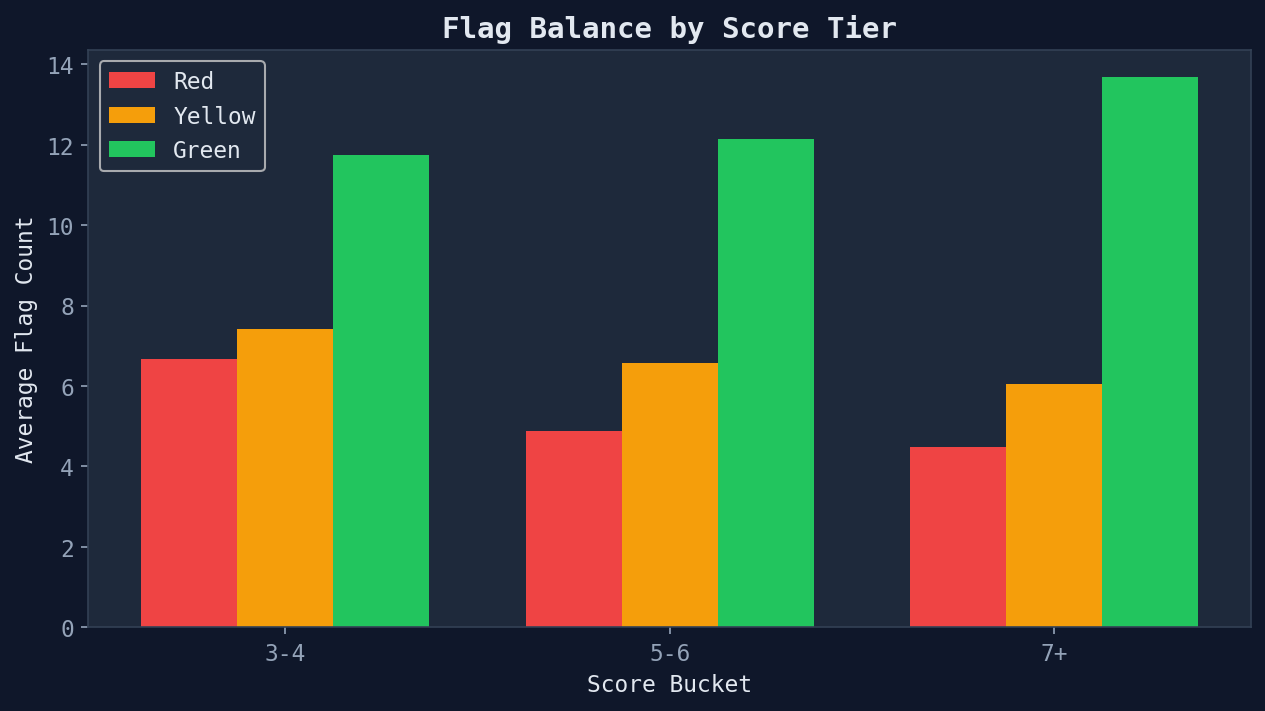
High scorers (7+) have more green flags and fewer red flags — but they still have red flags. The difference is in the severity: high scorers' red flags tend to be about audit period length, while low scorers' red flags are about missing controls.
Generated from red flag analysis module · 485 SOC 2 compliance reports · 2026-03-24